

Maps and GIS
Untapped potential.
Historically, the ArcGIS platform has been mostly used to present map-based information. There are many untapped capabilities in the ArcGIS platform. By adding them to our Digital products, we not only provide valuable tools to Council workers but also ensure we’re getting best value for money.
Key project details
 A corporate solution
 Flexible and accurate
 Reusable data
ArcGIS options
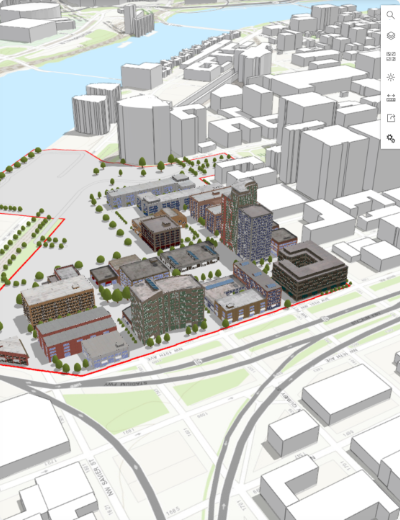
- ArcGIS Desktop and ArcGIS Pro: desktop tools allowing users across the Council to create, process and analyse geocoded data, and to create map-based visualisations of data
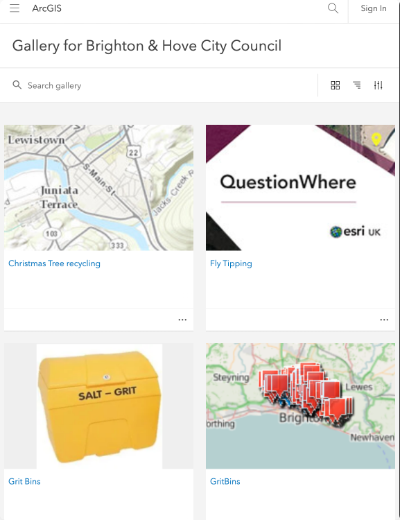
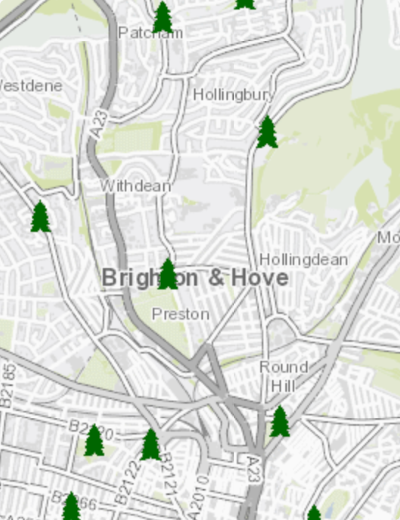
- ArcGIS Online: a cloud-hosted space where we host our publicly available maps. These maps cover topics as diverse as the City Plan, Gritting Routes, and Dog-friendly Beaches.
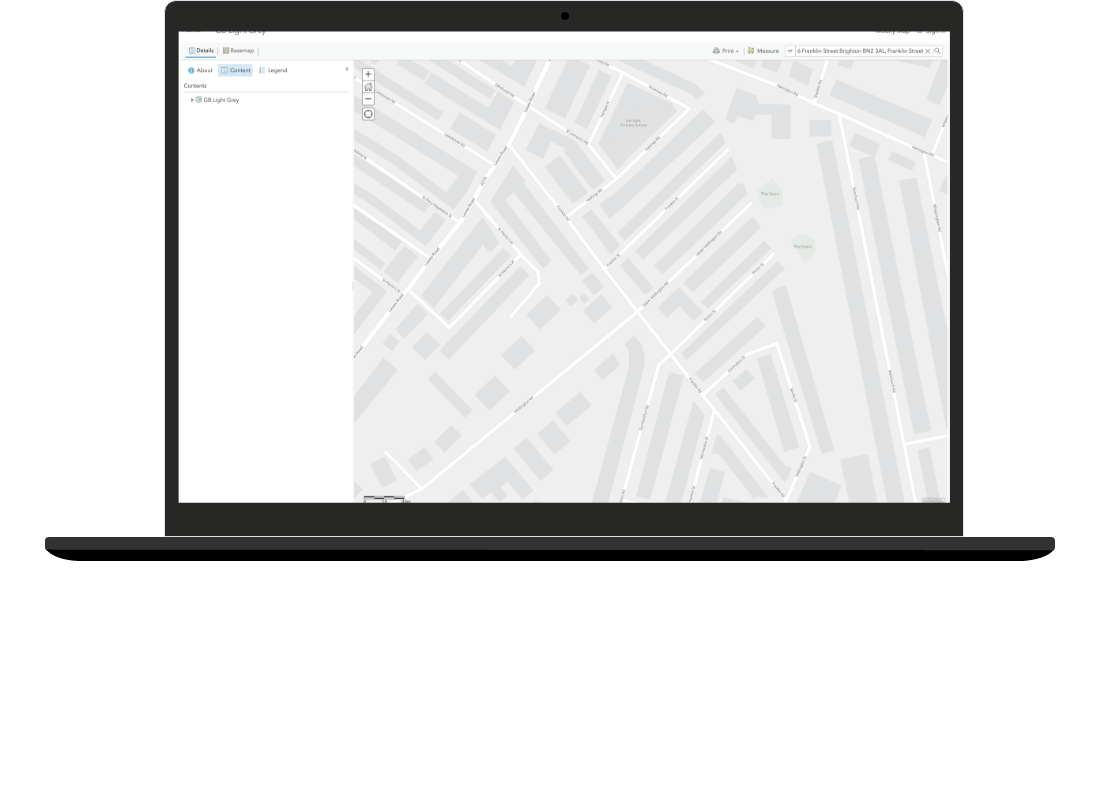
- ArcGIS Portal: an internal space where we host our internal maps. Some of these are corporately available—like the standard City Maps—but others are more restricted, due to data sensitivity.
- A geodatabase: where corporate data is stored in formats optimised for geospatial analysis.
- An API server: where we publish web services that can be called by multiple applications. These connect into the geodatabase and provide a secure and re-usable mechanisms for querying the data.
Functionality
- Mobile apps: Field workers can capture their activity on the go, pinpointing their exact location, uploading images, and feed it automatically back—where it can be immediately used for dynamic analysis to identify hotspots
- Measurement and querying: Using built-in widgets, users can carry out their own basic spatial analysis, such as identifying all properties in a specific area—simply by drawing a box or a circle or any shape
- Route optimisation: Defining optimal travel routes between a number of locations, taking into account one-way systems, hard-to-navigate roads, and even relative vehicle weight to calculate fuel costs
- Story maps: Rather than simple maps, analysts can combine maps with text and images, to create compelling narratives and lead readers to new insight
Whilst most of this experimentation has been done within the ArcGIS box, the COVID-19 crisis has pushed us to seek increasing integration between ArcGIS and other Digital platforms. We’re very excited to be integrating ArcGIS and Mendix—combining the two to get the best of both worlds.
This integration will allow data to flow from Mendix apps, like the COVID-19 Community Hub, into ArcGIS where maps can be built. It also allows Mendix to consume data from the ArcGIS geodatabase directly, ensuring we’re re-using our master data, maintaining that single version of the truth. Case Management data can be overlaid on (e.g.) Parking Zones, to help us address issues raised about parking permit allowances.
What's next
Perhaps most interesting is having integration that allows Mendix to call the geospatial analytics available in ArcGIS Online. Instead of needing to code our own analytic algorithms, we can re-use industry-leading capabilities. Using these, we could enhanced the Community Hub application to actually create delivery routes across Brighton & Hove, ensuring that we get food out to shielded people, in the most effective and efficient way possible.
Whilst this has been always possible using a variety of disconnected tools, generating the require network analysis manually every time, we can give that power to end-users through simple-to-use apps. Importantly, this approach means users don’t have to navigate two separate apps to achieve a single goal. The user experience is unified and simplified. This is only the start of our journey with GIS and spatial analytics. We’re investing in our GIS specialisms and really expanding our ideas of what’s possible.